I find myself without a particular topic in mind for a post this week, so I thought I’d share a little (read: enormous) project I’ve been working on since the start of the semester.
Brief preface: the main project of one of my courses is aimed at helping us to develop our research interests. Over the course of the 15 weeks of the semester, we’re gathering and annotating scholarly articles, conducting a historical overview of how our topics have been studied over the last 25 years, and documenting important scholars, journals, and associations in our fields. From what I can tell, most of my classmates are keeping track of this stuff through lists, folders, and spreadsheets — all totally normal and sensible organizational tools. But I’m weird. And I like math, and colors, and things I can drag around on screens. So, I took a little bit of a different approach to organizing my project information.
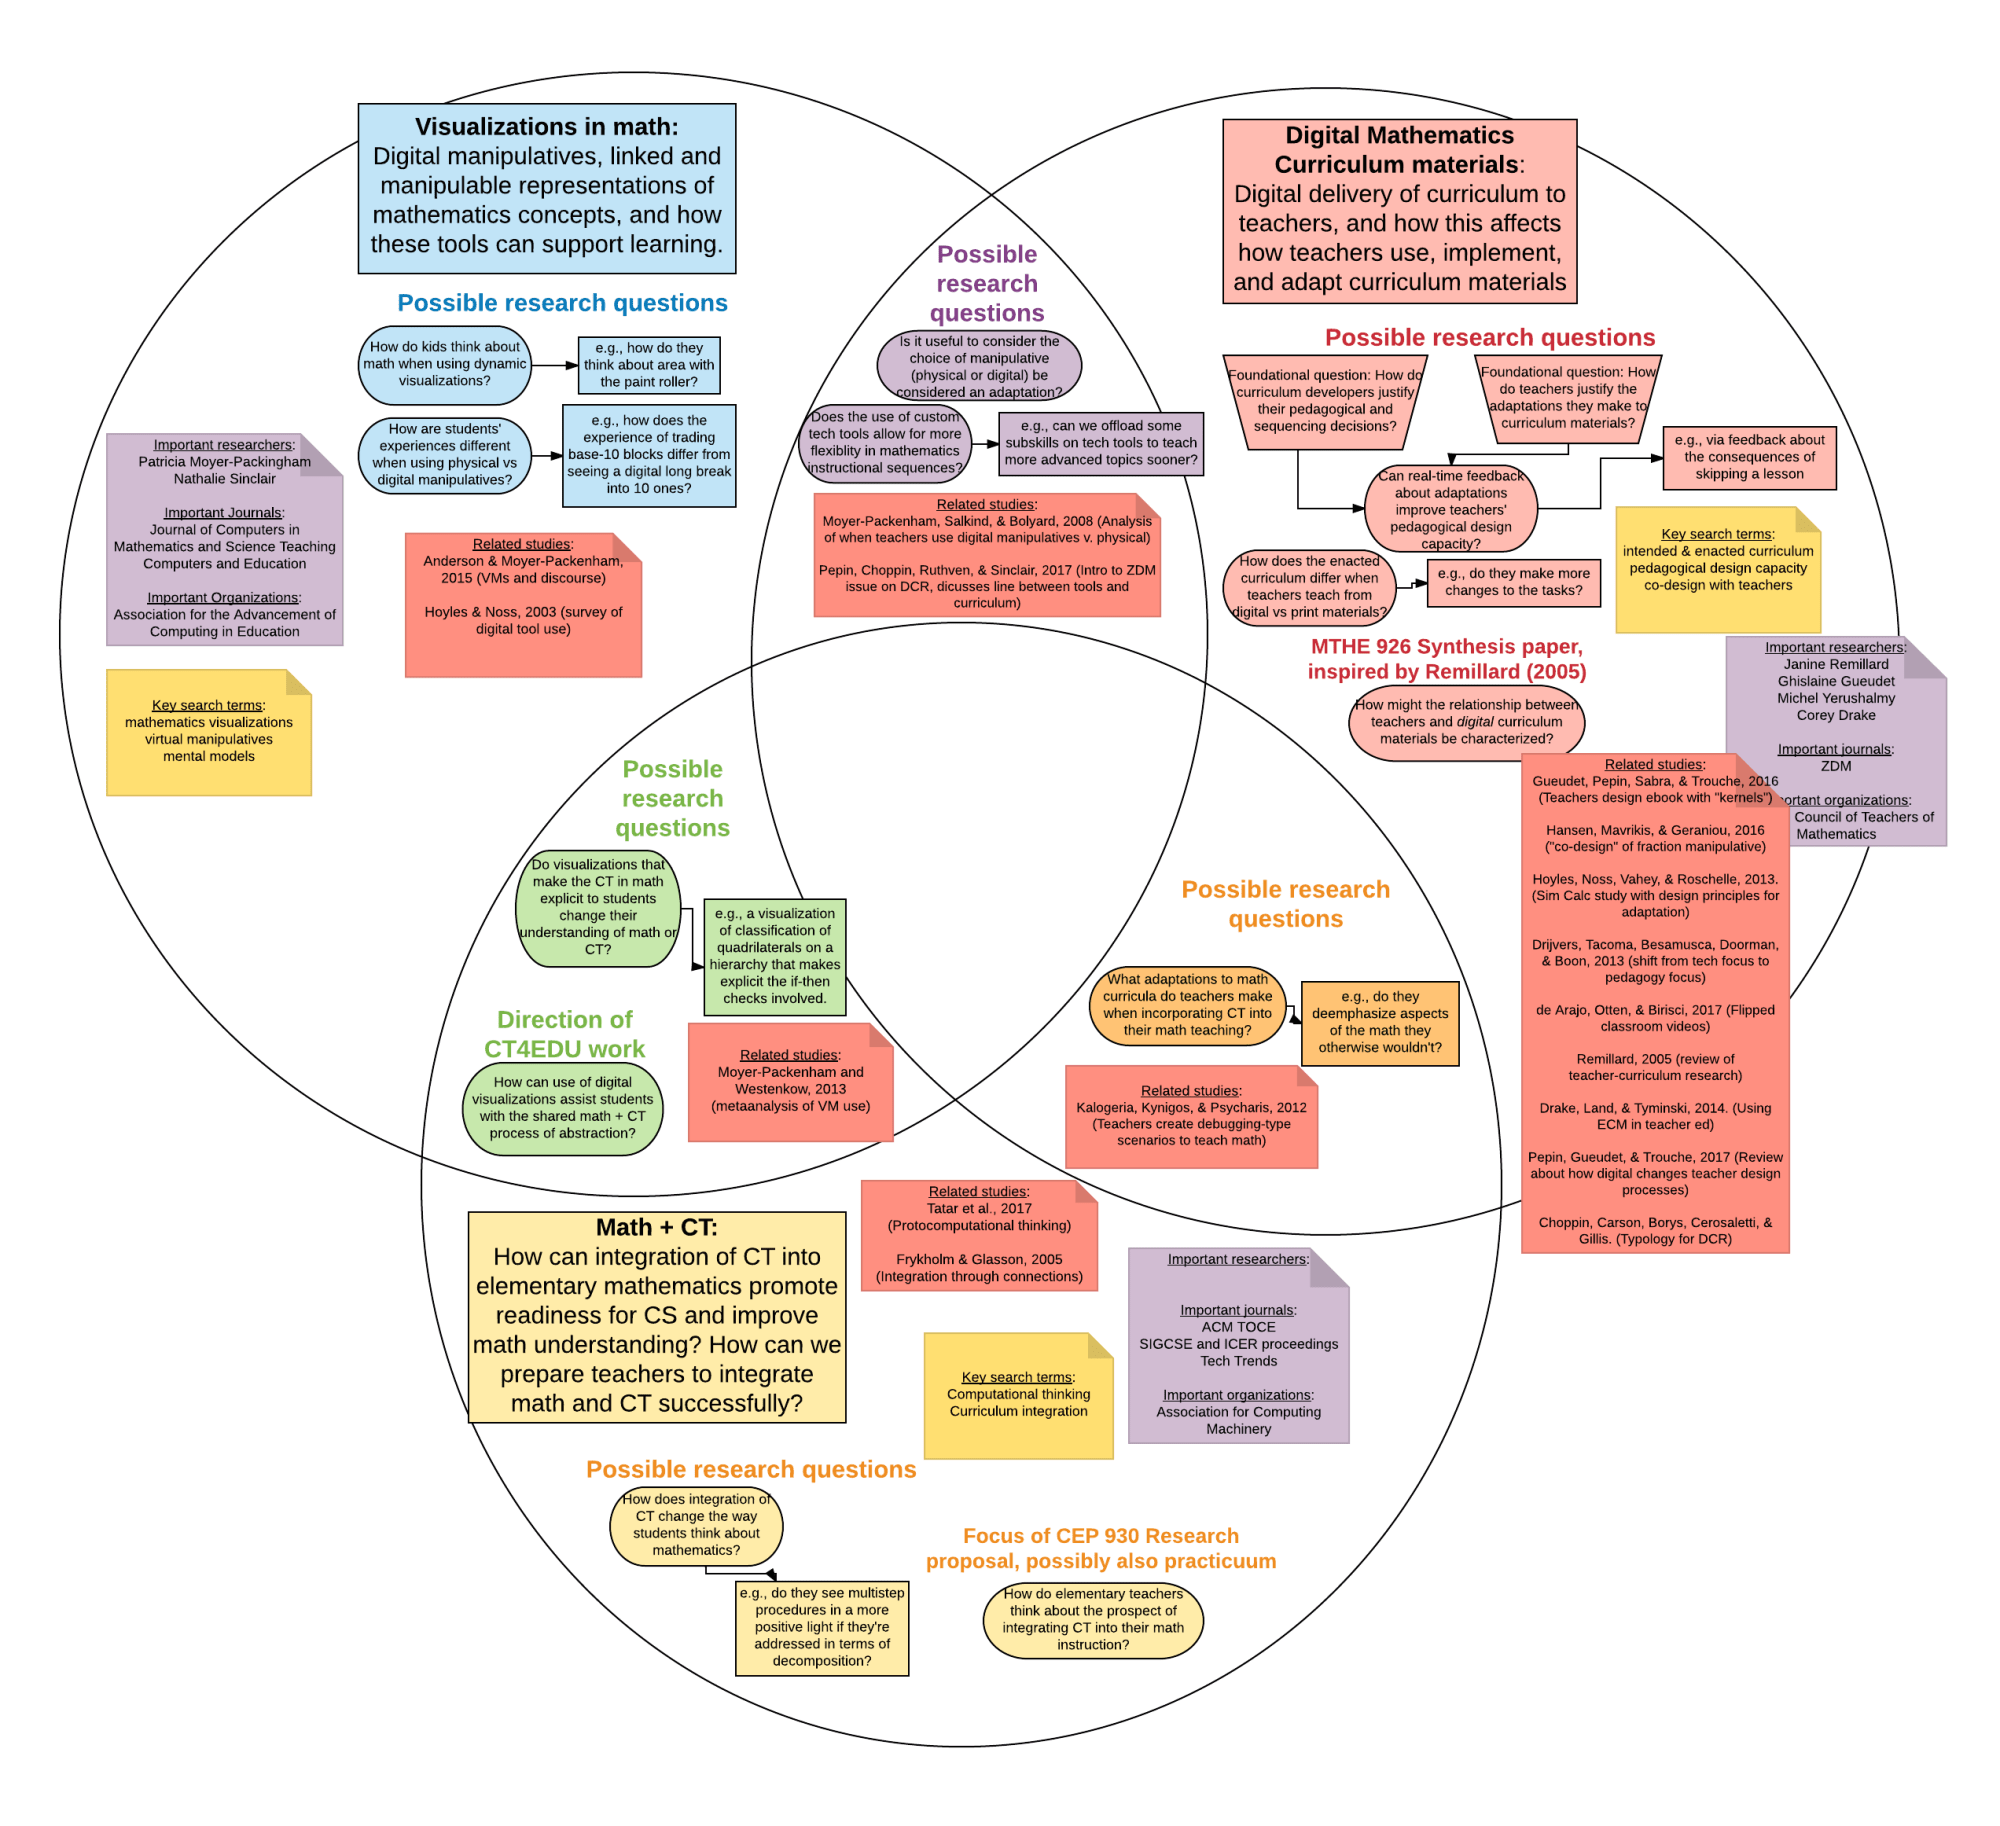
I present to you: my Venn diagram of research interests! (OK, so you already saw it above. That was the easiest way for me to make it big enough to see. But now you know what it is.)
The circle with the blue box and bubbles represents my first big area of interest: dynamic visualizations in math. In that circle live a lot of questions about the use of draggable interactives in mathematics, like digital versions of manipulatives and smart graphs that, for example, retain certain properties as you drag them. How does the use of stuff like this change the way kids think about math? How do we best leverage its potential? When are the times where it’s best to just put the tech away?
The circle with the red box and bubbles represents my second big area of interest: digital curriculum materials and how teachers interact with them. In that circle live questions about how digital materials can best support teachers in designing instruction for their specific contexts. How might feedback on instructional design decisions help teachers develop pedagogical design capacity?
The circle with the yellow box and bubbles represents my third big area of interest: the relationship between computational thinking (CT) — in brief, the thinking practices used by computer scientists, like abstraction, conditional relationships, and pattern recognition — and elementary mathematics. There’s a current push to bring computer science education to all kids in K-12, and when it comes to elementary school, I think integration of some CT ideas into mathematics is a great place to start. But what does math+CT instruction look like? How do teachers implement it? What is similar in mathematical thinking and computational thinking, and what’s different? When are those similarities and differences important?
The most interest part about exploring literature related to these topics has been discovering the ways in which they interrelate. One of the benefits of using digital manipulatives, for example, is that they seem to help kids abstract mathematical concepts (Moyer-Packenham & Westenskow, 2013) — and abstraction is a CT practice! That is what is living in the green section. Digital manipulatives (blue) + math and CT (yellow) = abstraction (green). The same research team who noted the connection between digital manipulatives and abstraction also did a study of how and when teachers choose to use digital manipulatives (Moyer-Packenham, Salkind, & Bolyard, 2008), and this study got me thinking about how the choice to use a digital manipulative is a critical part of the instructional choices teachers make when enacting curriculum. That is what’s living in the purple section. Teacher design decisions (red) + digital manipulatives (blue) = digital manipulatives as part of instructional design (purple). Last but not least, I recently read a study looking at how teachers use and adapt simple debugging tasks as part of their mathematics teaching (Kalogeria, Kynigos, & Psycharis, 2012). The tasks were not framed as debugging tasks by the researchers, but I definitely think they could be framed that way. So, that’s the orange section. Debugging tasks (yellow) + teacher design decisions (red) = how teachers use debugging tasks (orange).
As my advisors have told me many times already, I can’t expect to explore all of these questions in the four years I am in graduate school. But if I do end up in a research position later, these are the interconnected ideas that I hope will drive my program of research. If any of my faithful readers have recommendations for readings related to such things, I’d be glad to hear them.
To end, a fun exercise: What do you think goes in the center of the diagram?
References
Kalogeria, E., Kynigos, C., & Psycharis, G. (2012). Teachers’ designs with the use of digital tools as a means of redefining their relationship with the mathematics curriculum. Teaching Mathematics and its Applications, 31(1), 31-40.
Moyer-Packenham, P., Salkind, G., & Bolyard, J. (2008). Virtual Manipulatives Used by Teachers for Mathematics Instruction: Considering Mathematical, Cognitive, and Pedagogical Fidelity. Contemporary Issues in Technology and Teacher Education, 8(3), 202-218.
Moyer-Packenham, P., & Westenskow, A. (2013). Effects of Virtual Manipulatives on Student Achievement and Mathematics Learning. International Journal of Virtual and Personal Learning Environments, 4(3), 35-50.
